Dividend yield tends to capture most of our attention, especially when we start investing. But there is almost always a reason behind that number, and not seeing it can cost us dearly over the long run. In this guide I explain how to read the yield with context: <a href="/en/wiki/payout-ratio" title="The share of earnings a company pays out as dividends. It helps investors judge whether a dividend is sustainable." class="wiki-autolink">payout ratio, dividend growth, yield on cost and examples with real companies.
When you screen stocks by dividend yield, the brain runs a quick and dangerous calculation: "this one pays 9%, that one 2%… the 9% it is". If investing were that, sorting a table from highest to lowest yield would be enough.
It is not. Dividend yield is a snapshot of the present that says nothing about the sustainability of the payment or the future of the business. In fact, an abnormally high yield is very often a symptom of trouble, not an opportunity. It is what the dividend world calls a dividend trap.
In this article we look at what the yield actually measures, which metrics to cross-check it with, two real cases (the energy sector and Apple) and a numeric simulation of the key question: a high dividend today or a growing dividend tomorrow?
What dividend yield is (and what it is not)
Dividend yield is the percentage the annual dividend represents over the share price:
An example: if a stock trades at €50 and pays €2 a year, its yield is 4%. So far, simple.
The important nuance lives in the denominator: the price. Because the yield is calculated on the current quote, it rises when the price falls. A company whose stock collapses 40% sees its dividend yield shoot up without having raised the dividend by a cent. On the screener it looks most attractive exactly when its business is at its worst.
That is why the yield, in isolation, is not a measure of quality. It is only the starting point.
Why a high dividend can be a trap
Behind an 8–10% yield there is usually one of these three situations:
The price has fallen hard. The market is pricing in problems: falling earnings, excessive debt, a declining sector. The high yield is the thermometer of that distrust.
The payout is unsustainable. The company distributes more than it earns. It can keep that up for a while by draining cash or adding debt, but the usual ending is a dividend cut — and when it arrives, the price tends to fall again.
The business is not growing. The company pays out nearly all its earnings because it has nowhere to reinvest them. Today's dividend may be reasonable, but it will be the same (or lower) in ten years, with inflation eating a slice every year.
A numeric example of how a trap is built: a stock trades at €100 and pays a €4 dividend (4% yield). The business deteriorates and the price falls to €50. Without the company touching the dividend, the screener now shows 8% — twice as attractive in appearance, exactly the same payment in reality, and with far higher odds of a cut ahead.
The trap is completed by a psychological detail: collecting 8% a year feels good, and that delays the decision to sell while the capital deteriorates. Receiving €800 a year from a position that has lost €5,000 in value is not a good investment; it is a partial refund of your own money.
The 4 metrics that put the yield in context
Before buying for the dividend, always cross-check the yield with these four variables:
1. Earnings per share (EPS)
The dividend comes out of earnings. If EPS falls year after year, the dividend has an expiry date no matter how high the yield is today. Look for stable or growing earnings over the last 5–10 years.
2. Payout ratio
The payout ratio measures what percentage of earnings goes to the dividend. As a quick reference:
Payout
Reading
< 60%
Room to maintain and raise the dividend
60–80%
Sustainable, but watch the earnings trend
> 80%
Warning sign: little cushion for a bad year
> 100%
Unsustainable: paying out more than it earns
One common exception: REITs are legally required to distribute most of their income, so their payout over accounting earnings is misleading; there, the right metric is cash flow (FFO).
Accounting earnings can be dressed up; cash, much less so. If the dividend fits inside free cash flow, the company pays it with its own resources. If not, it is financing it with debt or share issues — feast today, cut tomorrow.
4. Dividend growth
Dividend growth over the last 5, 10 and 20 years tells the story the yield does not: what the company does when times get tough. The ones that have raised the payment without interruption for decades — the dividend aristocrats — have proven the dividend is a priority of their capital policy, not an accident.
Real case: four energy companies, two dividend models
Let's look at the 5-year performance (total return, dividends included) of four energy-sector companies with very different profiles:
Company
Yield
5-year total return
NextEra Energy (NEE)
1.8%
+195%
Public Service Enterprise (PEG)
3.3%
+75%
Exxon Mobil (XOM)
9.6%
+57%
Enbridge (ENB)
8.2%
+44%
The pattern is clear: the two companies with the highest yield delivered the worst total return. Exxon and Enbridge are stable businesses offering an attractive present reward, but with little growth runway. NextEra, with a seemingly modest 1.8% dividend, multiplied the value of the investment thanks to the growth of the business — and of its dividend.
They share a sector, but not a model: the composition of each business (oil at Exxon, renewables at NextEra) affects margins and growth. What should never be affected is the sustainability of the payment — and that is where the four metrics above make the difference.
If we are dividend investors, the present reward is not the end goal. The goal is building income streams that are sufficient, stable and growing over time. The balance between current yield and growth potential should be the priority.
Yield on cost: the metric that rewards patience
Enter the long-term investor's favourite metric: yield on cost, the dividend yield calculated on your purchase price, not on the current quote.
The classic example is Apple. Its current yield hovers around 0.7% — instantly discarded by any dividend screener. But:
When you bought
Approximate price
Current yield on cost
Today
current price
0.7%
Early 2019
$38
2.1%
2016
—
5.1%
Whoever bought a "low dividend" company in 2016 collects more on their investment today than someone buying a "high dividend" company now — and on top of that they accumulated the share's appreciation. Yield on cost turns dividend growth into real income, and it only needs one thing: time.
High dividend vs growing dividend: the numbers
Let's put figures on the decision. We invest €10,000 in two companies:
Company A: 6% yield, frozen dividend (€600/year, forever).
Company B: 2.5% yield (€250 the first year), but growing 10% a year.
Year
Annual income A
Annual income B
Yield on cost B
1
€600
€250
2.5%
5
€600
€366
3.7%
10
€600
€589
5.9%
11
€600
€648
6.5%
15
€600
€949
9.5%
20
€600
€1,529
15.3%
Company B overtakes A's annual income in year 11, and the cumulative total around year 18. Over 20 years, B has paid more in total (€14,300 versus €12,000) and its annual income is 2.5 times higher — not counting that a dividend growing at 10% usually comes with a business that grows too, with the corresponding appreciation.
Does this mean the high dividend always loses? No. If your horizon is short or you need the income now (for example, you already live off your portfolio), the bird in hand makes sense. The simulation says something else: if you have 10 or more years of accumulation ahead, dividend growth matters more than the initial yield. You can run your own numbers with our dividend reinvestment simulator.
How to apply it to your portfolio: a checklist
Before buying a stock for its dividend, review:
Yield within a reasonable range for its sector (9% where the average is 3% demands an explanation).
Payout < 80% of earnings (or of FFO for REITs).
EPS and free cash flow stable or growing over 5–10 years.
Dividend growth history: did it also raise the payment in 2008, 2020, 2022?
Debt under control: the dividend should not depend on refinancing.
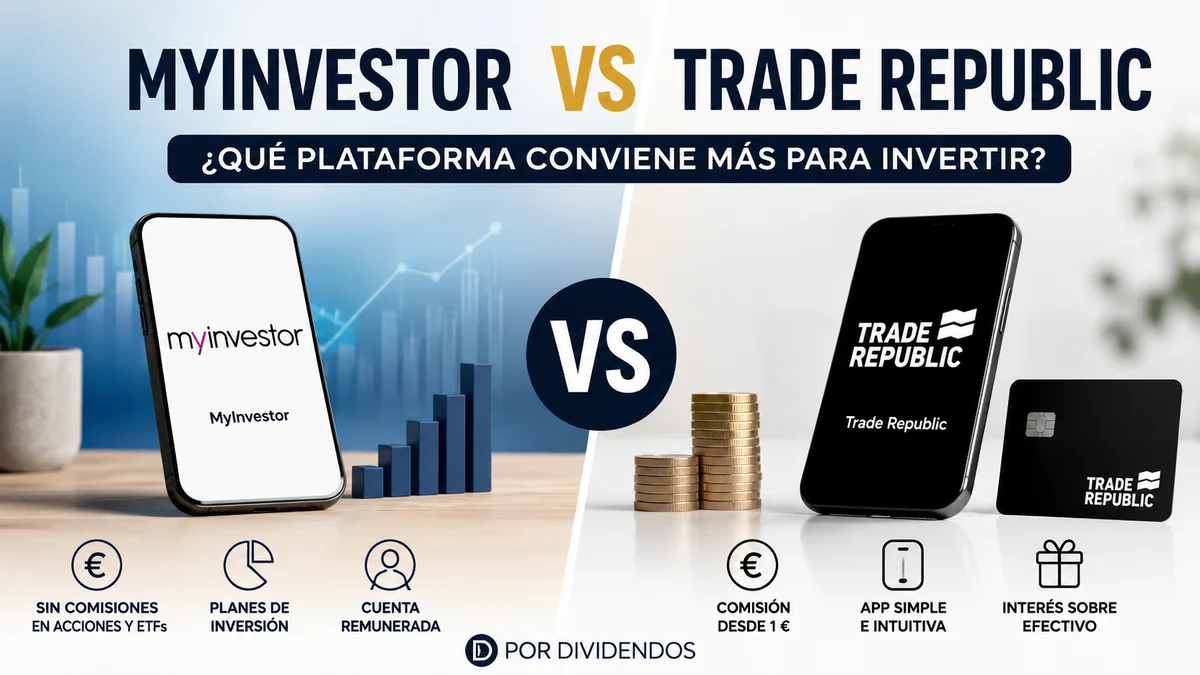
The right broker: dividend collection fees and currency exchange vary a lot; compare them in our broker comparison.
And if you want ideas filtered by growth history, you have our selection of European dividend aristocrats, updated for 2026.
Frequently asked questions
What is considered a good dividend yield?
It depends on the sector, but as a general rule a yield between 2% and 5% is usually healthy territory. Above 7–8%, the probability that the market is pricing in a cut rises sharply: analyse payout, debt and earnings before buying.
How is dividend yield calculated?
By dividing the annual dividend per share by the current price and multiplying by 100. A €40 stock paying €1.60 a year yields 4%.
What is a dividend trap?
A stock whose yield is high because its price has collapsed and/or because it pays out more than it earns. The dividend looks like the reward, but the likely scenario is a payment cut and further price falls.
Is a high dividend or a growing dividend better?
With a long horizon (10+ years), the growing dividend usually wins: the yield on cost ends up beating the static high yield, and the capital comes along. With a short horizon or an immediate income need, the sustainable high dividend has its place. What almost never pays off is the unsustainable high dividend.
Should I look at current yield or yield on cost?
Both, for different things. The current yield helps you decide new purchases; the yield on cost measures the real return of your position and the effect of dividend growth on your original investment.
How are dividends taxed in Spain?
They are taxed as savings income in the IRPF, on a progressive scale starting at 19%. If the company is foreign, you will also suffer withholding at source, which you can mitigate via double taxation treaties. The full detail is in our dividend tax guide.
Present performance is no guarantee of the future, and that is key in any long-term investment decision. Dividend yield is useful as a starting point, never as the sole argument: always look at what is behind the number.
This article is educational content, not financial or tax advice. Do your own analysis before investing.